
Technology
Performance Tuning Toolkit: Guide to Modern Optimization and System Performance
A Performance Tuning Toolkit has become one of the most essential resources for organizations that operate high-traffic, cloud-native, or enterprise-grade applications. In 2025 and beyond, businesses rely on fast, stable, and intelligent systems, and tuning tools now play a major role in ensuring reliability. These toolkits do much more than identify bottlenecks. They help engineers measure real-time performance, analyze system health, predict failures, and optimize architecture using AI-driven insights. Modern platforms such as IBM, Dynatrace, Datadog, and Grafana Labs now automate complex tasks that once required deep manual expertise.
Evolution of the Performance Tuning Toolkit
The earliest and most well-known toolkit emerged inside the ecosystem of IBM WebSphere. The classic IBM WebSphere Performance Tuning Toolkit, created with guidance from experts like David Spriet, became the first intelligent tuning platform that integrated monitoring, tuning, and problem determination in one interface. It relied heavily on the Performance Monitoring Infrastructure and JMX to gather live data. The toolkit converted raw metrics into multidimensional visual insights, helping engineers understand where system bottlenecks originated.
Over time, this early toolkit inspired entire generations of performance engineering solutions. It proved that optimization was not a one-time activity but an ongoing lifecycle. Modern toolkits now combine observability, AI modeling, distributed tracing, and developer-centric automation, reflecting the shift from manual tuning to continuous performance engineering.
Key Corporate Entities Influencing Performance Tuning Toolkits
Many organizations have shaped the technological landscape of tuning tools. IBM remains foundational because of its historic PTT and its observability platform Instana. HCL Technologies continues to support portions of the IBM software portfolio after acquiring key assets in 2019. Companies like Tricentis and Micro Focus (now OpenText) introduced enterprise-scale load-testing solutions that allowed businesses to simulate millions of transactions.
The rise of cloud-native systems brought new leaders such as Datadog, Dynatrace, Prometheus, and Grafana. Their influence grew as organizations moved toward Kubernetes, serverless infrastructure, and observability driven by real-user metrics.
Human Experts Who Shaped Performance Tuning
While modern toolkits rely on automation, the foundations were created by human specialists. David Spriet helped formalize IBM’s PTT documentation. Matthias Furrer became known for optimization methodologies in Oracle Fusion Middleware. Stefano Trallori developed the Oracle pttoolkit, one of the earliest collections of database tuning scripts. Authors such as Mike Loukides and Adam G. Neat documented the theory behind system tuning, influencing how organizations approach performance today.
Technical Entities Behind a Performance Tuning Toolkit
Core Monitoring and Diagnostic Technologies
Every Performance Tuning Toolkit depends on underlying technical entities. The Performance Monitoring Infrastructure provides live metrics, JMX exposes internal server data, and distributed tracing standards such as OpenTelemetry allow modern systems to observe microservices end-to-end.
Mathematical models like Amdahl’s Law continue to guide architects in predicting the potential gains from eliminating bottlenecks. Eclipse Foundation technologies shaped early graphical toolkits, including IBM’s PTT interface.
Modern AI-Driven Architectures
The evolution from manual tuning to AI-powered performance engineering is visible in today’s platforms. Dynatrace uses its Davis AI for automated root-cause analysis. Datadog uses Watchdog AI to detect anomalies before they reach production. Organizations that adopt continuous feedback loops now catch issues nearly twice as fast as those relying solely on manual reviews.
Categories of Modern Performance Tuning Toolkits
Cloud-Native Observability
Platforms such as Datadog APM, Dynatrace, and Prometheus with Grafana offer full-stack visibility across containers, microservices, and cloud workloads. They correlate traces, logs, and metrics in real time.
Developer-Centric Toolkits
New Relic is widely used for rapid onboarding and code-level diagnostics. k6 by Grafana has become the standard for scriptable load testing, allowing developers to write tests in JavaScript and integrate them with CI/CD pipelines. Locust introduced Pythonic modeling for more natural traffic simulation.
Enterprise and Legacy Optimization
Tools such as IBM Instana support hundreds of modern and legacy technologies, including mainframes. LoadRunner remains the enterprise favorite for high-scale load simulation. Organizations maintaining legacy mobile systems often rely on Embrace for crash analytics and performance insights.
Essential Methodologies Inside Every Performance Tuning Toolkit
The Profile–Optimize–Measure Cycle
Most tuning frameworks follow a structured process that begins with profiling the system, identifying pain points, optimizing configurations, and measuring results. With each iteration, teams refine their understanding of performance trends.
Establishing Baselines
Before tuning can begin, engineers must define clear performance baselines. Metrics such as Largest Contentful Paint under 2.5 seconds guide improvement in web environments. Baselines allow teams to detect regressions early.
Architecture-Level Optimization
Studies from 2025 show that the vast majority of performance gains come from architecture changes rather than micro-optimizations. This includes redesigning database queries, improving service communication paths, or restructuring caching layers.
Legacy Impact of IBM WebSphere Performance Tuning Toolkit
The IBM WebSphere PTT still exists as a free, as-is toolkit available through IBM Support Assistant. It remains valuable for those working with traditional WebSphere environments. Users running Windows 10 or 11 often face SOAP connector errors unless a JRE directory is placed directly inside the toolkit folder.
The legacy of this toolkit lives on in modern observability tools that fully automate what once required manual investigation. By transforming PMI metrics into visual cubes, it influenced how dashboards are designed today.
Why Performance Tuning Toolkits Matter in 2025 and Beyond
A Performance Tuning Toolkit is now essential for maintaining uptime, supporting scalability, and protecting revenue in high-traffic environments. Research shows that companies with strong performance engineering practices experience far fewer production incidents and maintain better customer satisfaction. Continuous optimization is no longer optional; it is a competitive advantage.
FAQs
What is a Performance Tuning Toolkit?
It is a collection of diagnostic and optimization tools designed to measure system performance, locate bottlenecks, and improve speed, stability, and scalability.
Why is AI important in modern tuning tools?
AI reduces root-cause analysis time, detects anomalies automatically, and helps teams identify performance issues before they impact users.
What industries rely on these toolkits the most?
E-commerce, finance, telecommunications, cloud platforms, and any business that serves high-traffic applications rely heavily on tuning and observability tools.
Is the IBM WebSphere Performance Tuning Toolkit still used?
Yes, it remains available as a free tool within IBM Support Assistant and continues to be helpful for teams maintaining WebSphere systems.
Which toolkit is best for developers?
k6 and New Relic are popular choices due to their ease of integration, scriptable testing, and fast setup.

FinTechRevo.com has emerged as a powerful platform in the rapidly evolving world of financial technology. It serves as a comprehensive knowledge hub that simplifies complex fintech topics while also offering expert consulting and executive coaching services. Designed for beginners, startups, SMEs, and professionals, the platform focuses on delivering practical insights into digital finance, helping users understand and adopt modern financial solutions with confidence.
What is FinTechRevo.com?
FinTechRevo.com is an educational and informational ecosystem dedicated to the Financial Technology Revolution. Unlike traditional financial platforms, it does not operate as a bank or investment service. Instead, it focuses on providing unbiased, research-backed content that explains complex topics like blockchain, cryptocurrency, digital banking, and AI in finance in a clear and simple way.
The platform is widely recognized as a neutral and non-commercial hub where users can learn about fintech without the pressure of promotions or subscriptions. It is designed to make financial innovation accessible to everyone, from students to business owners.
Core Focus Areas of FinTechRevo.com
The platform covers a wide range of fintech topics that are shaping the future of global finance. One of its primary focuses is artificial intelligence in finance, where automation and AI-driven financial forecasting are transforming how businesses manage operations. It also explores blockchain technology, highlighting its role in enhancing transparency, security, and efficiency in financial transactions.
Another major area is cryptocurrency and digital assets, including insights into Bitcoin, Ethereum, and evolving cryptocurrency regulations. Alongside this, FinTechRevo.com provides valuable information on neobanking, digital payments, and corporate payment solutions, helping users understand modern alternatives to traditional banking systems.
Educational Content and Market Insights
A key strength of FinTechRevo.com lies in its high-quality educational content. The platform offers in-depth guides, blog articles, and market analysis that cover fintech trends, global market indices, and financial automation. Each piece of content is crafted to provide practical, real-world insights rather than theoretical explanations.
The site also publishes market research and industry reports that help businesses stay updated on fintech adoption trends, regulatory changes, and emerging technologies. By offering clear and actionable insights, it enables users to make informed decisions in a fast-changing financial landscape.
Business Consulting and Executive Coaching
Beyond education, FinTechRevo.com provides specialized business consulting services and executive coaching programs. These services are designed to help companies integrate fintech solutions into their operations. From selecting the right payment gateways to implementing AI-powered financial tools, the platform offers tailored recommendations based on each business’s needs.
This is particularly valuable for small to medium-sized enterprises that may lack the internal expertise to navigate complex fintech systems. With access to experienced consultants, businesses can streamline their operations, improve cash flow management, and enhance financial reporting.
Why FinTechRevo.com Matters for Businesses
In today’s digital economy, adopting fintech solutions is no longer optional. Businesses must embrace tools like digital wallets, peer-to-peer payment systems, and automated financial software to remain competitive. FinTechRevo.com plays a crucial role by guiding organizations through this transformation.
The platform helps businesses identify opportunities for growth, reduce transaction costs, and improve operational efficiency. Its focus on practical solutions ensures that companies can implement fintech strategies that deliver measurable results.
Safety, Legitimacy, and Accessibility
One of the standout aspects of FinTechRevo.com is its commitment to safety and transparency. The platform is considered legit for informational use because it does not require users to share sensitive financial data or connect bank accounts. Its content is free, accessible, and designed to be user-friendly, making it ideal for beginners and professionals alike.
The Future
As fintech continues to evolve with advancements in AI, blockchain, and digital banking, FinTechRevo.com is well-positioned to remain a leading resource. Its combination of education, market insights, and consulting services ensures that users stay ahead of trends and make smarter financial decisions.
By bridging the gap between complex technology and practical business application, FinTechRevo.com is shaping how individuals and organizations understand and adopt the future of finance.
Summary
| Category | Details |
|---|---|
| Platform Name | FinTechRevo.com |
| Type | Educational and Informational Fintech Platform |
| Core Purpose | Simplify complex financial technology concepts and provide business consulting |
| Key Focus Areas | AI in finance, blockchain, cryptocurrency, digital banking, neobanking, RegTech |
| Services Offered | Educational content, market insights, business consulting, executive coaching |
| Target Audience | Beginners, startups, SMEs, professionals, students, business owners |
| Content Style | Free, neutral, non-promotional, easy-to-understand |
| Key Features | Guides, articles, industry reports, fintech analysis, software recommendations |
| Business Benefits | Improved efficiency, better financial strategy, cost reduction, scalability |
| Safety Level | Safe for informational use, no sensitive data required |
| Technologies Covered | AI, automation, blockchain, digital payments, financial forecasting |
| Industry Coverage | Global fintech trends, market indices, cryptocurrency regulations |
| Platform Goal | Help users understand and adopt fintech solutions effectively |
FAQs
What is FinTechRevo.com and what does it offer?
FinTechRevo.com is an educational platform that provides insights into financial technology, including AI in finance, blockchain, and digital banking. It also offers consulting services to help businesses adopt fintech solutions.
Is FinTechRevo.com safe and legit to use?
Yes, FinTechRevo.com is considered safe because it is not a financial service provider. It does not require users to share sensitive financial data or connect bank accounts, making it reliable for informational purposes.
Who can benefit from FinTechRevo.com?
Beginners, startups, SMEs, professionals, and business owners can benefit from FinTechRevo.com. It is designed to simplify complex fintech topics for users at all levels.
Does FinTechRevo.com provide business consulting services?
Yes, FinTechRevo.com offers business consulting and executive coaching. These services help companies integrate fintech tools like payment systems, AI solutions, and financial software into their operations.
What topics does FinTechRevo.com cover in fintech?
The platform covers a wide range of topics, including cryptocurrency, blockchain technology, AI-driven finance, digital payments, neobanking, financial automation, and global market trends.
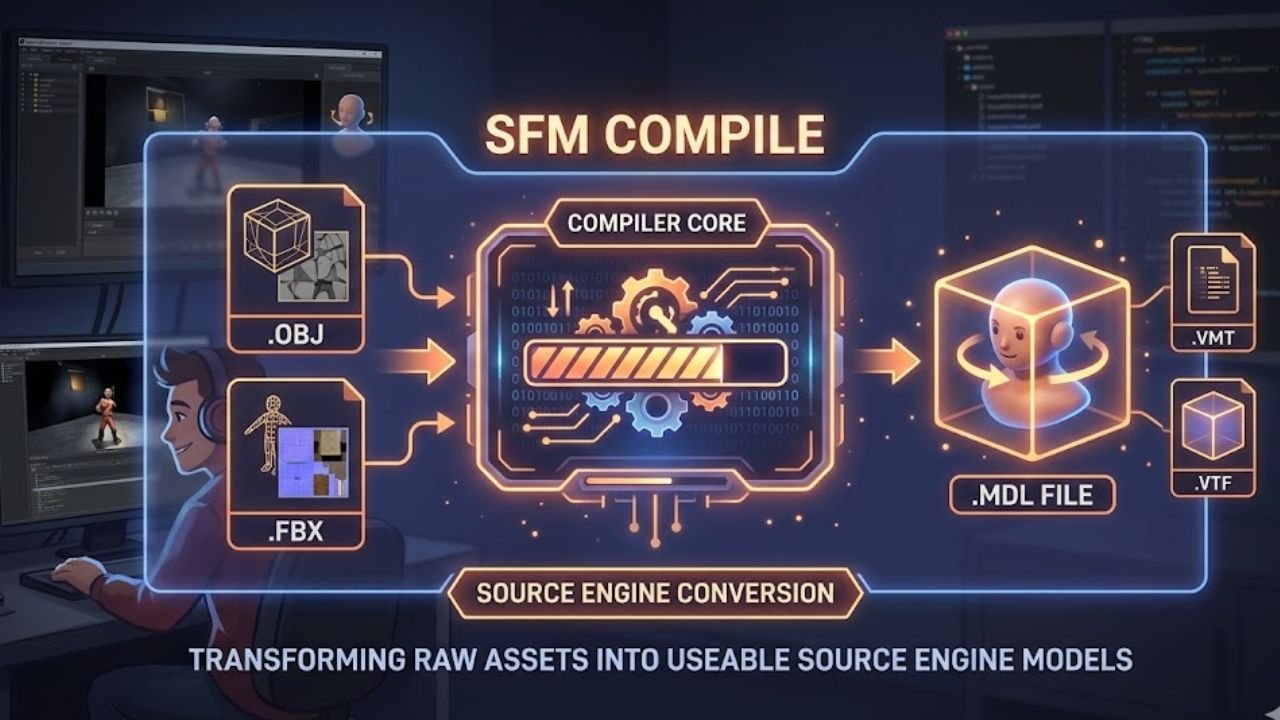
SFM Compile is one of the most important parts of working with Source Filmmaker. If you want a custom model, prop, character, animation asset, or map to work correctly inside the Source Engine, the asset usually needs to go through a compile process first. This process turns raw 3D files into formats that SFM can actually read. Without it, models may fail to appear, textures may break, or the engine may crash during production.
Even today, SFM remains popular because of its strong cinematic look, huge community asset library, and detailed control over animation and materials. At the same time, it is built on an older 32 bit architecture, so creators must work carefully within strict limits. That is why understanding SFM Compile is not just helpful. It is necessary for anyone who wants stable, high quality results.
What Is SFM Compile?
In simple terms, SFM Compile is the technical workflow that converts source files from programs like Blender into Source Engine ready assets. Source Filmmaker cannot directly use common formats like OBJ or FBX in the same way many modern tools can. Instead, creators prepare meshes, rigs, textures, and animations, then compile them into files such as MDL, VVD, VTX, and PHY.
The process acts like a bridge between the modeling stage and the animation stage. It ensures the engine understands the mesh structure, material paths, skeleton, collision rules, and animation sequences. A successful compile makes a model visible, usable, and stable inside the SFM browser and viewport.
Why SFM Compile Still Matters
Many creators still rely on Source Filmmaker because it offers a unique balance of control and familiarity. The engine has access to a massive asset ecosystem built over many years from games like Half Life, Team Fortress 2, and Garry’s Mod. That library alone keeps SFM relevant for animators, modders, and fan creators.
Another reason is the visual style. Source lighting, especially compiled lighting and volumetric effects, still has a strong cinematic feel. On top of that, the QC file gives creators detailed control over bones, facial flexes, jigglebones, bodygroups, materials, and animations. While the workflow is older and more manual, many artists still value that precision.
Core Parts of the SFM Compile Workflow
Source files and exports
The first part of the workflow begins in a 3D program, most often Blender. The creator builds or edits the mesh, rigs the model to a skeleton, assigns materials, and prepares animation data if needed. After that, the asset is exported into Source friendly formats such as SMD or DMX with Blender Source Tools.
The QC file as the blueprint
The QC file is the instruction sheet for the whole compile. It tells the compiler what to do with the source files. It defines the final model name, the material directory, the base mesh, animation sequences, and even the collision model. In many ways, the QC file is the heart of SFM Compile because it controls how the asset behaves inside the engine.
StudioMDL and Crowbar
The real conversion work is done by studiomdl.exe, which is Valve’s command line compiler. Most users do not run it directly. Instead, they use Crowbar, which is the most common graphical interface for SFM compiling. Crowbar makes it easier to select the game target, load the QC file, run the compile, and review any error messages.
Important Tools Used in SFM Compile
Blender and Blender Source Tools
Blender is widely considered the standard modeling tool in the SFM community. It handles mesh editing, rigging, skinning, material assignment, and animation preparation. Blender Source Tools are used to export compliant SMD or DMX files for the Source ecosystem.
Crowbar
Crowbar remains one of the most important tools in this workflow. It simplifies compiling, decompiling, and diagnosing model problems. It also helps users point the asset to the correct Source Filmmaker version of studiomdl.exe.
VTFEdit and Notepad++
VTFEdit is essential for turning image textures into VTF files and helping create VMT material instructions. Notepad++ is often used for fast manual editing of QC and VMT files, especially when fixing material paths, shader values, or folder structure mistakes.
HLMV and Hammer Editor
HLMV, or Half Life Model Viewer, helps creators verify the compiled model. It is useful for checking texture errors, animation issues, and visible gaps between body parts. Hammer Editor is more focused on maps and environments, where VMF files are compiled into BSP maps through internal systems like VBSP, VVIS, and VRAD.
Understanding the Main SFM File Types
Source file formats
Source files include SMD and DMX for models and animations, VMF for maps, QC for compile instructions, and image files like PNG or TGA before they are converted into Source texture formats. These are the working files creators edit before the final compile happens.
Compiled output formats
A successful SFM Compile usually creates several output files. The MDL file acts as the main model header. VVD stores vertex data. VTX contains hardware specific optimization data. PHY stores physics collision information. For textures, VTF holds the image data while VMT defines how the material behaves in the engine.
How High Poly Models Are Handled in SFM
The bodygroup workaround
One of the most important techniques in SFM Compile is splitting a model into bodygroups. This is the common workaround for Source 1 polygon and vertex limits. Instead of compiling one massive mesh, the creator divides it into smaller parts such as the torso, head, arms, and legs. These are then stitched together in the QC file with bodygroup blocks while remaining attached to the same skeleton.
Why splitting helps
This method helps because the engine treats each bodygroup as a separate sub model. It reduces the chance of compile failure and lowers the risk of shattering, invisible geometry, or rendering glitches. It also makes it easier to control different sections of a detailed character.
Safe mesh limits
Creators often try to keep split parts under about 10000 to 18000 vertices during export, even though the broader bodygroup limit is often described around 65536 vertices. The practical goal is stability, not just theoretical maximums. Many artists also try to keep models around 21000 faces per bodygroup to avoid trouble during compile and playback.
QC Scripting Basics for Better Results
Common QC commands
A QC file usually contains commands such as modelname, cdmaterials, body, bodygroup, sequence, and collisionmodel. These commands define the file structure of the model, the texture path, the source mesh, animation clips, and physical interaction rules.
Why pathing matters so much
A huge number of SFM compile problems come from bad pathing. If the cdmaterials value is wrong or the VMT points to the wrong texture folder, the model may show the famous purple and black checkerboard pattern. Many creators spend more time fixing paths than fixing the mesh itself.
Texture and material precision
Texture accuracy matters at every stage. Materials should be assigned correctly in Blender before export. Then the VTF and VMT files must match the expected folder structure exactly. Even small naming mistakes can break the final result.
Engine Limits Every Creator Should Know
Source Filmmaker is a legacy 32 bit application, and that affects almost everything. The program usually works within roughly 3.5 to 4 GB of RAM. If a project goes too far beyond that, the software may close without warning. This is one of the most frustrating parts of using SFM in modern production.
There are also hard or practical limits for vertices, bones, controllers, and flexes. Models often face a bodygroup limit around 65536 vertices. Bone counts are commonly kept around 128, although community patched tools like StudioMDL CE can push higher. Controller counts can also become a problem if a model gets too complex. In short, SFM Compile is always a balance between visual quality and engine stability.
Common SFM Compile Errors and Fixes
A checkerboard texture usually points to broken material paths or missing VTF and VMT files. An invisible model often suggests scale or export issues. A shattered mesh usually means the geometry is too heavy for the compiler or was split badly. An access violation crash may happen when the model exceeds safe engine limits or when the compile uses too much memory.
These problems can often be reduced with careful QC editing, lower triangle counts, bodygroup splitting, LOD systems, and better material setup. Many creators also use Blender’s Decimate Modifier when a mesh is simply too dense for safe use in Source 1.
Modern Changes and Alternatives
The compile world has changed a lot in recent years. Blender Source Tools continue to support newer Blender releases, and Crowbar has become better at handling batch processing and memory related logs. Community tools like StudioMDL CE have also pushed some old limits further, especially for flexes and jigglebones.
At the same time, Source 2 tools and S&box represent a much more modern direction. These workflows support hotloading, visual model editing, faster updates, and 64 bit memory handling. S&box in particular removes much of the old compile waiting cycle. Still, for classic Source projects and stylized animation, SFM Compile remains highly relevant.
Final Thoughts
Learning SFM Compile can feel difficult at first because it combines art, scripting, technical limits, and engine specific rules. But once the workflow becomes familiar, it gives creators strong control over how models, textures, animations, and physics behave inside Source Filmmaker.
The key is to think like both an artist and a technician. Keep meshes optimized, write clean QC scripts, manage materials carefully, and respect the limits of the engine. When you do that, SFM can still produce excellent results, even in a world full of newer tools.
FAQs
What does SFM Compile mean in Source Filmmaker?
It means converting raw 3D assets like meshes, rigs, textures, and animations into Source Engine ready files that SFM can load and use properly.
Why is my model showing purple and black in SFM?
This usually happens because the material path is wrong or the required VTF and VMT files are missing or placed in the wrong folder.
Why do creators split models into bodygroups in SFM?
They do it to bypass Source 1 vertex and polygon limits. Splitting a high detail model into bodygroups helps prevent compile failure and rendering issues.
What tool is most commonly used to compile models for SFM?
Crowbar is the most commonly used graphical tool. It runs Valve’s studiomdl.exe and helps users compile QC based models more easily.
Is SFM Compile still worth learning today?
Yes. It is still useful for creators working with Source assets, legacy model libraries, stylized animation, and detailed QC based control inside Source Filmmaker.
Techtales Pro-Reedcom is not just another website that talks about software, gadgets, or coding tools. It is a modern digital platform built to make technology easier to understand, more human, and more useful. Instead of showing only dry facts, it combines technical documentation with storytelling, collaboration, and practical learning. That is what makes it stand out in a crowded tech space.
For readers who want more than basic updates, Techtales Pro-Reedcom offers a fresh experience. It brings together real technical insights, human experiences, expert opinions, and strong educational value. Whether someone is a beginner, a developer, a freelancer, an educator, or part of a product team, this platform gives them a place to learn, share, and grow.
What Is Techtales Pro-Reedcom?
A Platform Built by Pro-Reed Com
Techtales Pro-Reedcom is a multi functional technology platform created by Pro-Reed Com. It is designed to bridge the gap between technical documentation and narrative driven content. In simple words, it helps people explain technology through real stories, practical experiences, and clear technical details.
More Than a Traditional Tech Blog
Unlike a normal tech blog, Techtales Pro-Reedcom is not limited to news posts or product updates. It works like a hybrid ecosystem. It acts as a professional blog, a documentation repository, a collaboration space, and a knowledge sharing platform at the same time. That wider purpose makes it valuable for both casual readers and serious tech professionals.
Why Techtales Pro-Reedcom Stands Out
A Human Centered View of Technology
One of the strongest features of Techtales Pro-Reedcom is its human centered approach. Many platforms talk only about tools, systems, and code. This one also talks about the people behind them. It highlights startup founders, developers, educators, small business owners, and creators who use technology in real life.
This storytelling style gives readers better context. A product becomes more interesting when readers understand why it was built, what problems it solved, and what challenges appeared during development. That is why Techtales Pro-Reedcom feels more relatable than many other technology websites.
A Balance of Knowledge and Enjoyment
The platform does not treat learning as something boring. It blends knowledge with entertainment, often using light commentary, simple explanations, and engaging storytelling. This makes technical topics easier to digest, especially for readers who may feel overwhelmed by complex language.
Content for Different Skill Levels
Techtales Pro-Reedcom is built for a wide audience. Beginners can explore simple tutorials and inspiring stories. Experienced developers can study deeper technical documentation, postmortems, and workflow discussions. This accessibility is one of the reasons the platform has such strong long term value.
Main Content Areas on Techtales Pro-Reedcom
Tech News and Updates
The platform keeps readers informed about major developments in the tech world. This includes software updates, new gadgets, digital trends, and emerging innovations. Readers who want to stay aware of what is happening in technology can use this section as a steady source of information.
Interviews With Innovators
Techtales Pro-Reedcom also features interviews with entrepreneurs, innovators, industry leaders, and experienced builders. These conversations offer insights into product creation, business growth, technical problem solving, and personal leadership. For aspiring founders and creators, this section can be especially motivating.
Product Reviews and Recommendations
Trusted Advice for Tech Buyers
Another important section covers detailed product reviews. These reviews help readers understand the strengths and weaknesses of devices, tools, and software solutions before making a purchase. Because the platform focuses on depth and clarity, the review content becomes useful for both consumers and professionals.
Tutorials and How To Guides
Practical Learning for Real Skills
The tutorial section is one of the most useful parts of the platform. It includes beginner friendly lessons as well as more advanced guides. Some readers may want to understand the basics of coding. Others may want to learn how to build a startup, improve workflows, or solve technical problems. Techtales Pro-Reedcom supports both goals.
Opinion Pieces and Thought Leadership
The platform also publishes thought leadership content on major topics such as ethics in tech, artificial intelligence, and the future of digital systems. These pieces encourage readers to think more deeply about how technology shapes society, work, and everyday life.
Inspirational Tech Tales
This is the most distinctive section of the platform. These stories focus on perseverance, creativity, growth, and technical experience. They may feature self taught programmers, startup founders, developers recovering from failures, or teams learning from crisis points. These stories give technical knowledge emotional depth and human meaning.
Core Technical Features Behind the Platform
Integrated Code Support
Techtales Pro-Reedcom supports code snippet embedding with syntax highlighting. It directly supports popular programming languages such as Python, JavaScript, C++, Java, and Go. This makes it useful for technical storytelling that needs real code examples.
Smart Tagging and Searchability
The platform includes a smart tagging system that helps organize technical content. It can identify and group material related to AWS, Azure, GCP, Kubernetes, Docker, Django, Flask, MERN, and MEAN. This creates an advanced searchable knowledge base for readers and teams.
Timeline Visualization
One standout feature is timeline visualization. This allows teams to map milestones, sprints, crisis points, and project progress. Traditional documentation often misses this time based context, but Techtales Pro-Reedcom uses it to tell a fuller story.
Visual and Diagram Support
The platform also supports terminal outputs, original error logs, and diagrams from tools such as Lucidchart and Draw.io. This improves clarity and helps readers understand technical systems in a more visual way.
Collaboration and Team Workflow Features
Role Based Access Control
Techtales Pro-Reedcom supports three key user roles. Authors create and own content. Reviewers check quality and accuracy before publication. Editors maintain consistency across the platform. This structure is especially useful for professional teams and enterprise documentation.
Version History and Rollbacks
The platform records changes through detailed version history. Users can compare edits side by side and roll back to older versions when needed. This is important for documentation quality, team trust, and content control.
Private Tales for Secure Work
For teams working under NDAs or handling sensitive information, Private Tales offers invite only spaces. This feature shows that the platform is not just public facing. It can also support internal knowledge management and secure collaboration.
AI and Future Innovation
AI Summarization Beta
Techtales Pro-Reedcom includes an AI powered summarization feature in beta. This tool scans long technical stories and extracts important lessons, decisions, and takeaways. It helps readers quickly understand large pieces of content without losing the main message.
What the Roadmap Suggests
The future roadmap of the platform is ambitious. It includes a VS Code plugin, a mobile app, and a public API for third party integration. There are also plans for richer multimedia experiences, including interactive content and even augmented reality ideas for technical storytelling. These features show that Pro-Reed Com wants Techtales Pro-Reedcom to become a full knowledge ecosystem, not just a blog.
Who Can Benefit From Techtales Pro-Reedcom?
Developers and Engineering Teams
Developers can use it for postmortems, sprint retrospectives, and story based technical documentation. Teams can preserve institutional knowledge in a clearer and more memorable format.
Educators and Students
Educators can connect theory with real world technical examples. Students can learn not only what a concept is, but also how it works in practice.
Freelancers and Creators
Freelancers can build dynamic portfolios that explain the before and after story of projects. This is far stronger than a simple list of services or a static resume.
Open Source Maintainers
Project maintainers can use the platform to explain why architectural decisions were made, adding context that normal GitHub README files often miss.
Everyday Readers
Casual readers also benefit because the content is written in an accessible style. They can stay informed about technology without feeling lost in technical jargon.
Challenges and Areas for Growth
Like many growing platforms, Techtales Pro-Reedcom also faces some challenges. One issue is discoverability. As more content is added, valuable insights can be buried under trending topics. Another challenge is enterprise security. As the platform expands into more professional use cases, stronger security and compliance support will matter even more.
Still, these challenges do not weaken the platform’s value. Instead, they show that it is growing into a more serious and ambitious digital product.
Conclusion
Techtales Pro-Reedcom stands out because it does something many technology platforms fail to do. It makes technology feel human. By combining storytelling, code support, collaboration tools, documentation structure, and educational value, it creates a richer experience for modern readers and teams. Built by Pro-Reed Com, the platform is evolving into a smart space where technical knowledge, real stories, and practical learning come together.
For anyone who wants to understand technology in a deeper yet more relatable way, Techtales Pro-Reedcom is a name worth paying attention to.
FAQs
What is Techtales Pro-Reedcom?
Techtales Pro-Reedcom is a digital platform created by Pro-Reed Com that combines tech storytelling, technical documentation, tutorials, reviews, and collaboration features in one place.
Why is Techtales Pro-Reedcom different from other tech blogs?
It is different because it focuses on the human side of technology. It does not only explain tools and systems. It also shares the stories, struggles, decisions, and experiences behind them.
What technologies are commonly featured on Techtales Pro-Reedcom?
The platform often highlights Python, JavaScript, C++, Java, Go, Kubernetes, Docker, Django, Flask, AWS, Azure, GCP, MERN, and MEAN.
Who is Techtales Pro-Reedcom made for?
It is made for beginners, experts, developers, educators, freelancers, open source maintainers, entrepreneurs, and casual readers who want clear and useful tech content.
What future features may come to Techtales Pro-Reedcom?
Its roadmap includes AI powered summarization, a VS Code plugin, a mobile app, a public API, more interactive media, and deeper personalization for readers.

Why More People Are Looking Beyond Designer Perfume Brands

What Audi drivers usually change in the summer: the most popular spare parts in the warm season

A Helpful Guide to Comparing Condo Prices and Unit Designs
Who is Cuppy Enders? The Untold Story of Tommy Shaw’s First Wife
Who Is Sylvia Dale? Learn About The Wife of Johnnie Cochran

Scalable Industrial Solutions with Smart Design Systems & Financial Precision
-
 Celebrity7 months ago
Who is Cuppy Enders? The Untold Story of Tommy Shaw’s First Wife
-
 Celebrity7 months ago
Who Is Sylvia Dale? Learn About The Wife of Johnnie Cochran
-
 Business3 months ago
Scalable Industrial Solutions with Smart Design Systems & Financial Precision
-
 Celebrity10 months ago
Who Is Yeonmi Park’s Husband? Ex-Husband Ezekiel, Marriage, Divorce & Family Facts and More
-
 Technology4 months ago
How System Maintenance Tools Improve Computer Performance and Security
-
 Celebrity9 months ago
Happy Dad Net Worth: Owners, Revenue & Brand Value
-
 Celebrity9 months ago
Crispy Heaton – Musician, Father of Charlie Heaton & His Untold Story
-
 Biographies6 months ago
Who Is Agnetha Larsson? The Untold Story of Zara Larsson’s Mother